The Achievement Overview report in the Analytics feature, allows staff to view information and statistics on achievement points in their schools. Achievement data recorded in Edulink One is written back as live data to SIMS.
Log in to Edulink One and click on the Analytics icon to begin.
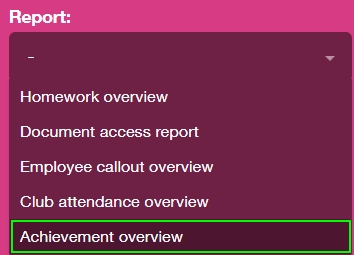
Select the Achievement Overview report from the Report dropdown menu.
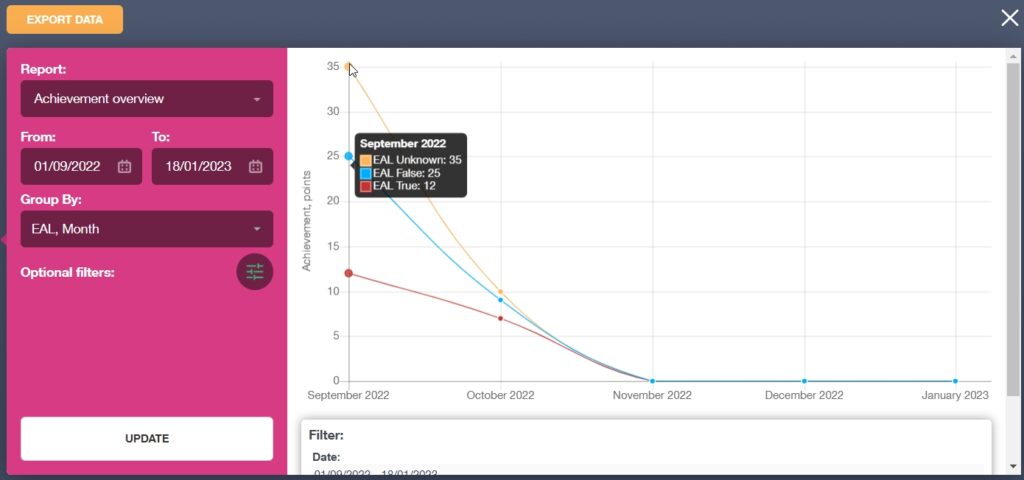
The report contains a date range, a group by selector and an options filter. The window to the right of the settings will display the data selected in graphs.
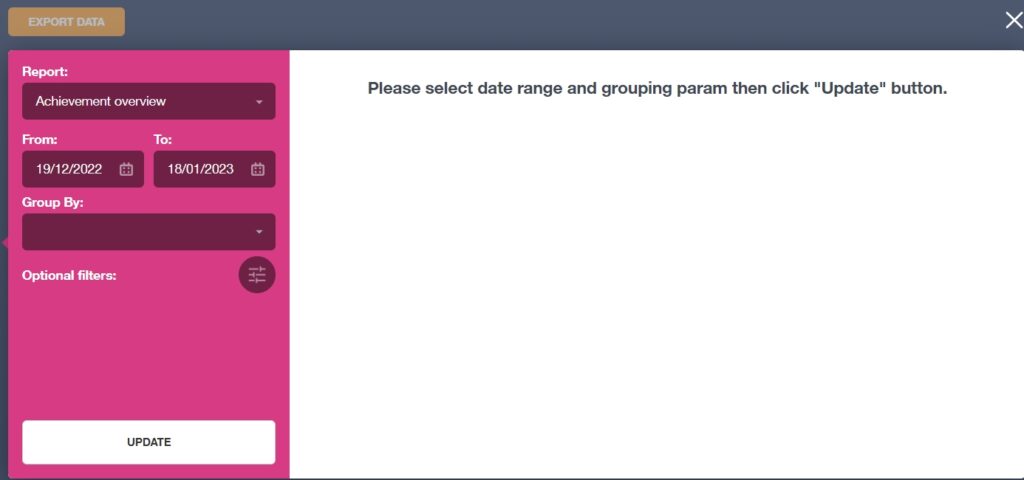
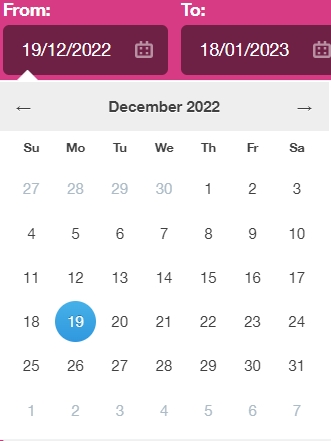
Select the date range by selecting the ‘from’ and ‘to’ dates in the calendars. This will pull all the data from the date range you have selected.
Group By Filter
Next, select the ‘Group By’ filter and decide what data you would like to base your achievement point analysis on.
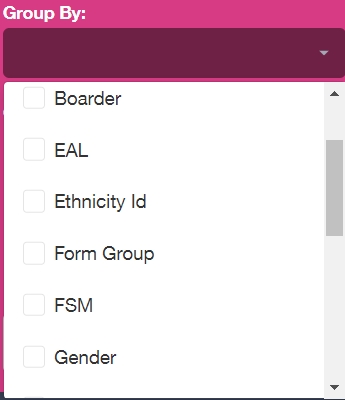
You can group by:
- Activity Type (English, Geography etc…)
- Boarder
- EAL
- Ethnic Identity
- Form Group
- FSM
- Gender
- Has Medical Condition
- House Group
- In Care
- Month
- PP
- Recorded by
- SEN Status
- Student
- Type
- Week
- Year Group
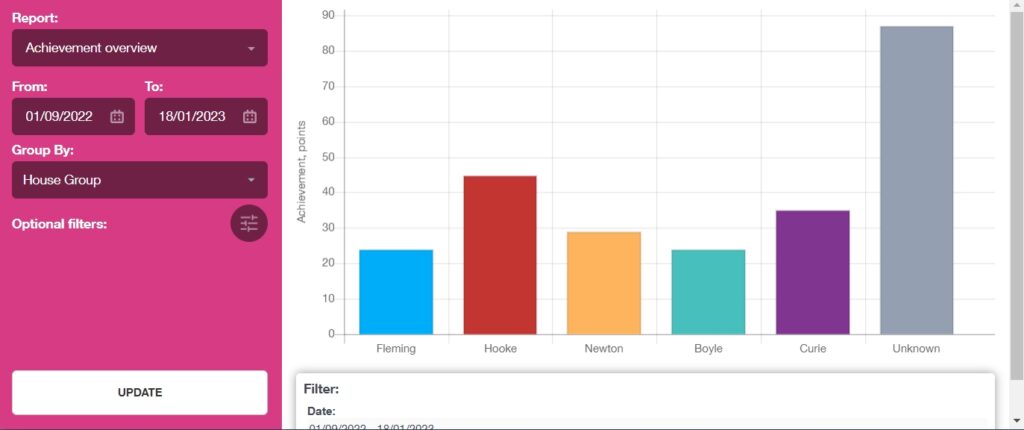
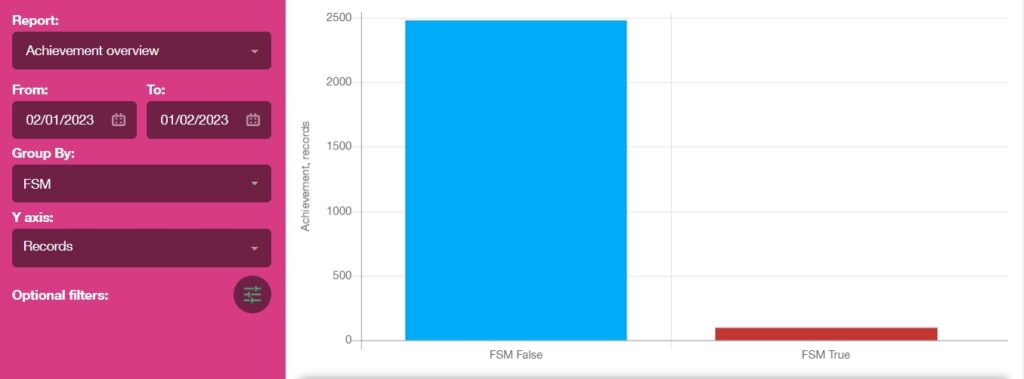
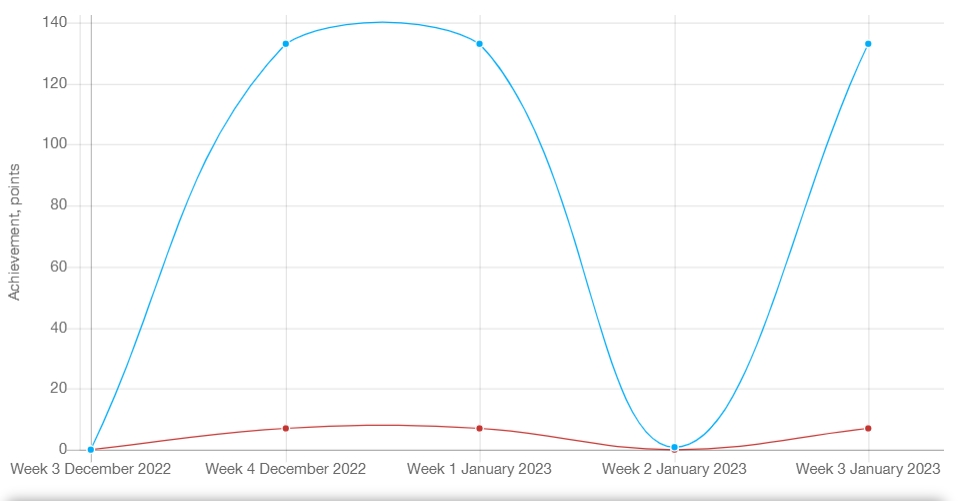
If you only select one data set to group by, your chart will appear as a bar chart with any additional information located at the bottom of the chart (X-axis). The achievement points/records will always appear on the Y-axis.
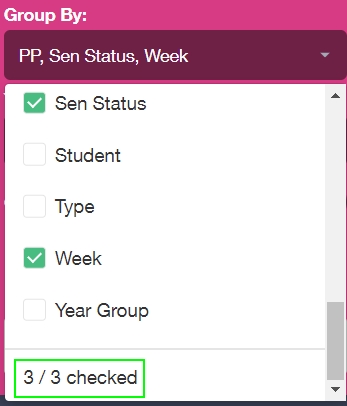
You can also select multiple data sets to group by (up to three things), for example, PP (Pupil Premium) and Week (per week).
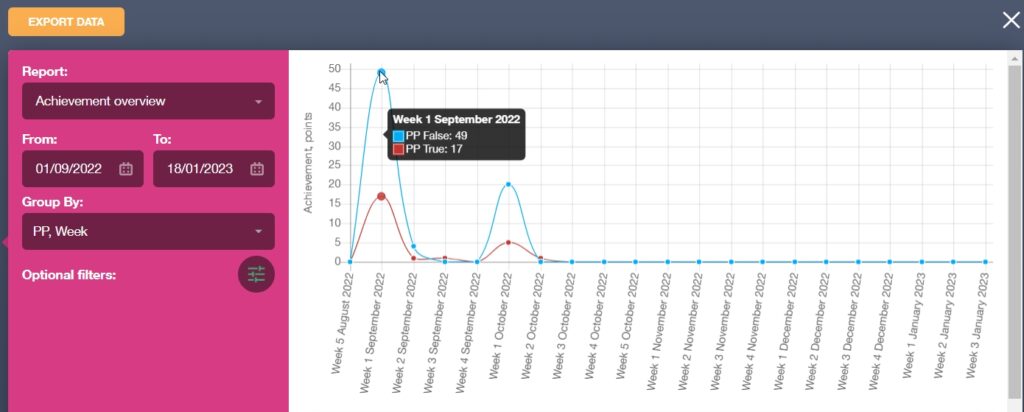
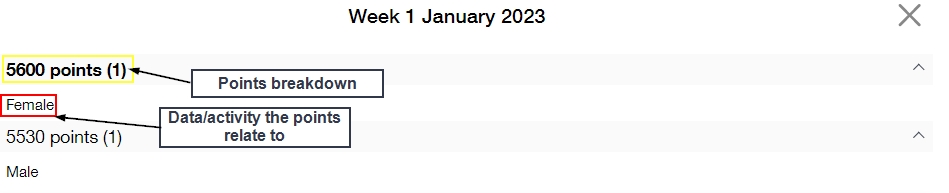
If you are grouping data and including the month or the week data set, you can click on the points on the line graph to reveal a key and a breakdown of the points and activity/data they are connected with below.
Y-Axis Selector
You can select whether you would like to base your Y-axis data on the number of achievement records given to learners, e.g. merit, bronze award, outstanding effort, etc… Each achievement record counts as 1.
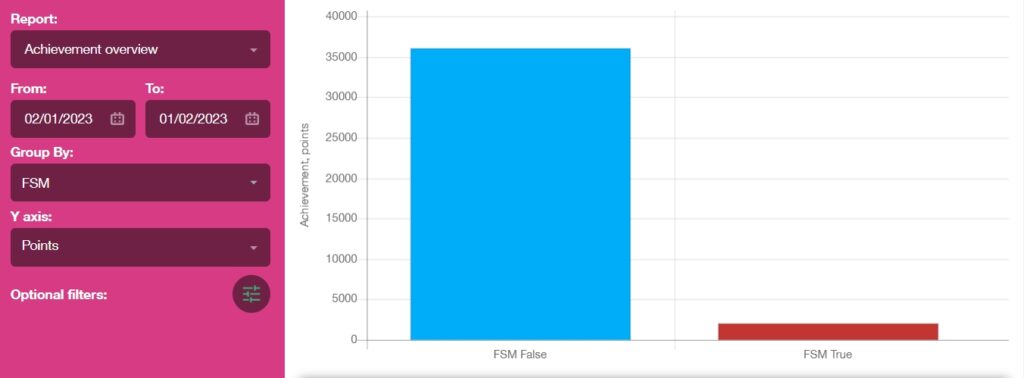
If you choose to base the Y-axis on points, the Y-axis will return totals for the number of points given to pupils for each achievement recorded. For example, a merit might be worth 1 point and a bronze award might be worth 6. Edulink One will calculate the total points for each individual achievement record for the groups and options you include in the filters.
Optional Filters
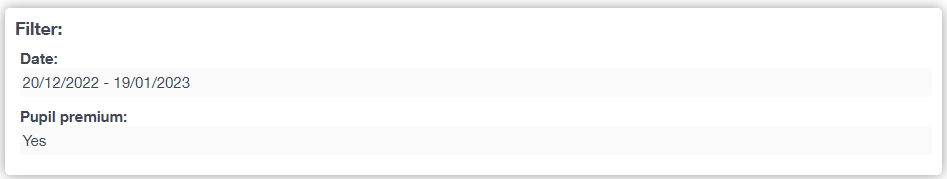
The optional filters allow staff to exclude records from the data set selected by the date range, for example, if you only want to look at the records for year 10 students, you would select ‘year 10’ in the Year filter.

You can select:
Students
Achievement types
Recorded by employee
Involving employee
Gender
Form
Year
House
Ethnicity
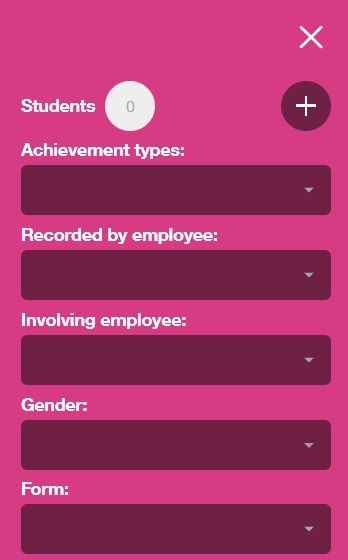
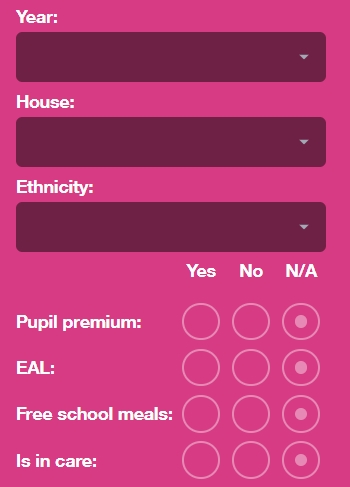
Additionally, you can add or exclude the following from your data set selected in the ‘Group By’ filter:
- Pupil Premium
- EAL
- Free school meals
- Is in care
- Has a medical condition
- Is SEN
- Boarder

Once you have selected your optional filters, hit Apply. You can also cancel or reset your filters at this point.

Once you have hit apply, you will return to the main screen and then click ‘Update’.

Your graph will be generated with the data in the window adjacent.
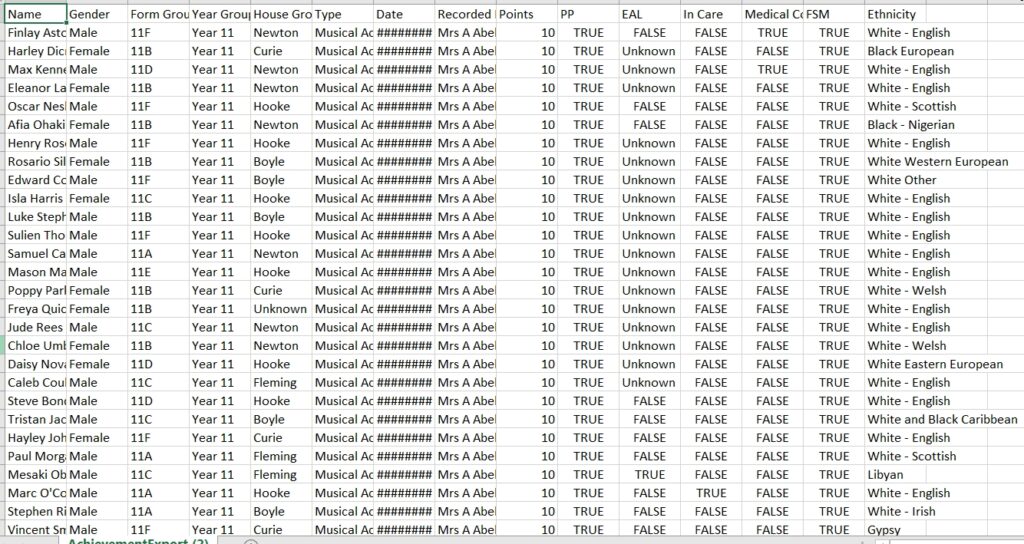
Exporting
You can export the base data you would like to process to a .csv file. This can be used for your own analytics, to look at records and create your own graphs.

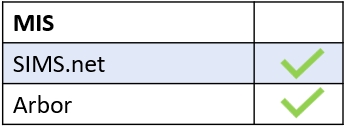
Achievement Overview (Arbor)
Achievement Overview does work with the Arbor MIS with these current filters, as these are the data fields available:
Group By
- Form
- Gender
- House Group
- Month
- Recorded by
- Student
- Type
- Week
- Year Group
Optional Filters
- Students
- Achievement types
- Recorded by employee
- Involving employee
- Gender
- Form
- Year
- House
Achievement and Behaviour Overview Reports Video
MIS Compatibility