Analytics in the user interface always appears for employees only, but this depends on the configuration of your Analytics tab.
To view analytics reports, log in to Edulink One and click the Analytics icon. This will be located in the More icon on the main homepage.
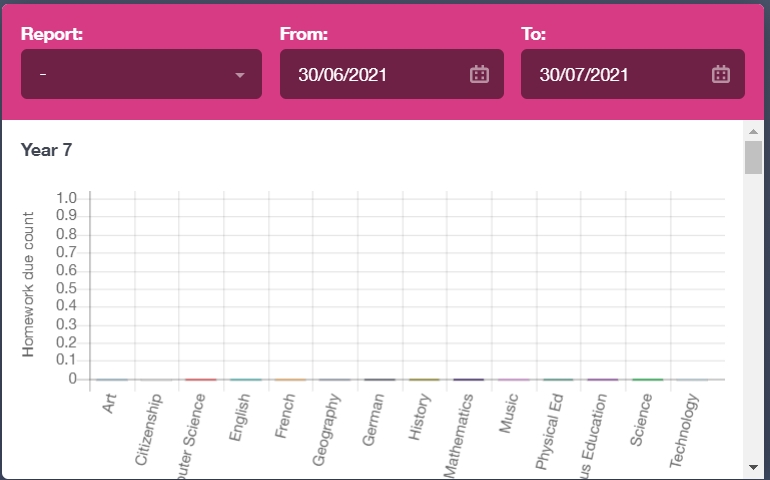
Within the Analytics function, you can choose from different types of reports to gather data. You can also set the From date using the calendar and the To date using the calendar.
You can scroll to view the data from various year groups, for example.
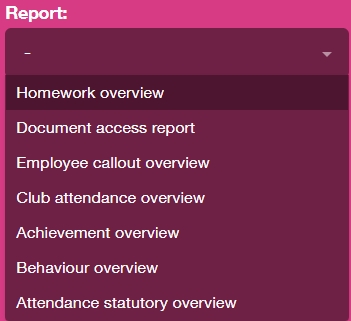
You can select seven report types from the dropdown menu: Homework Overview, Document Access Report, Employee Callout Overview, Club Attendance Overview, Achievement Overview Report, Behaviour Overview Report and Attendance Statutory Report.
Homework Overview
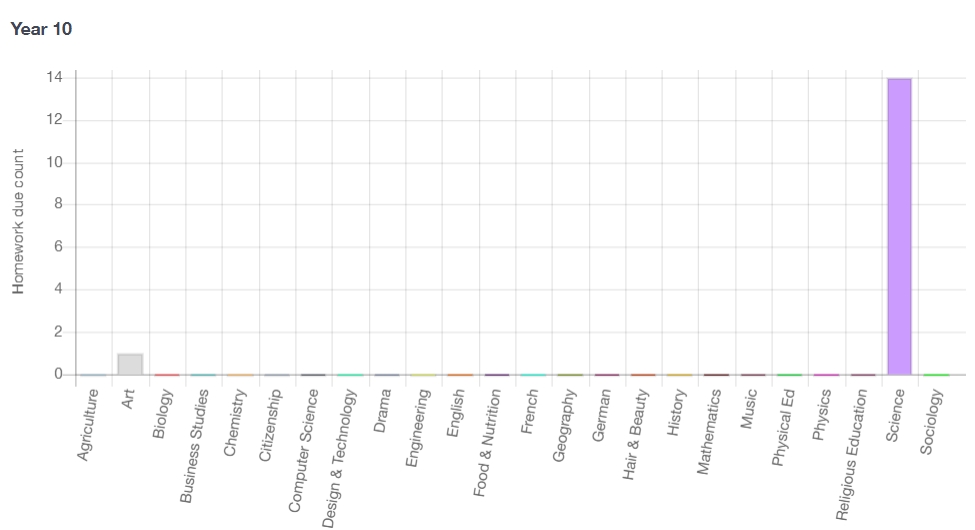
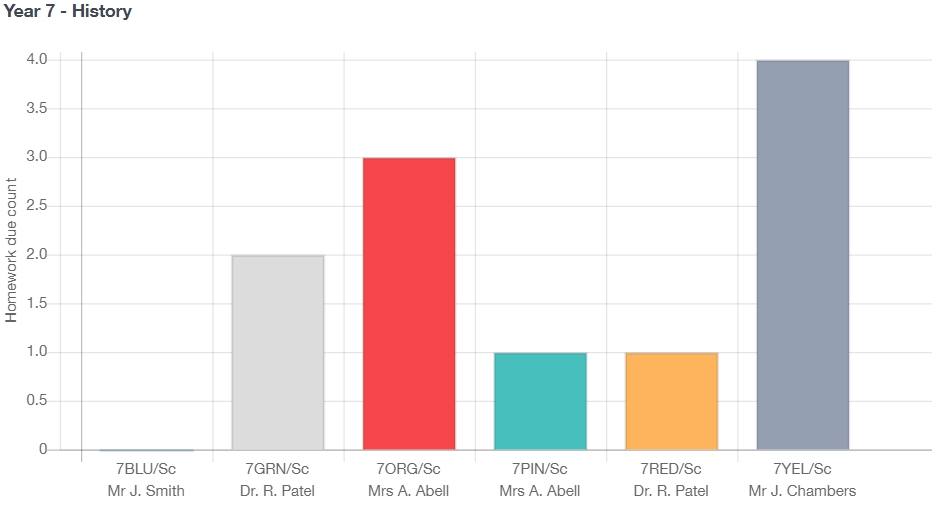
Homework analytics are broken down by year group and subject. Each Year has a specific graph with subjects along the X-axis. The homework count appears along the Y-axis, as in the table below.
It is a bar chart so the subjects that assign the most homework will appear as having a larger bar than those that assign little homework.
If you click on a subject bar, you can see a breakdown of the homework by teacher in each subject. Teachers that have assigned the most work appear with a longer bar. If desired, you can click on the bar to view the name of the homework set, the due date and other details, if included.
You can export the homework data by clicking the ‘Export Data’ button at the top of the window.
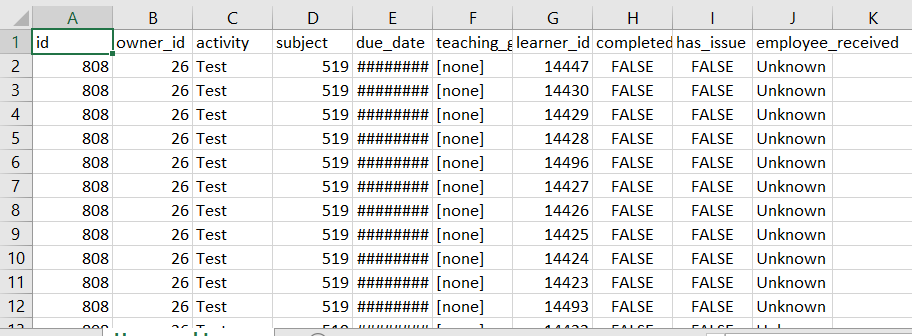
A zip file containing information on Employees, the Homework set to the learners, the Learners, Subjects and Teaching Groups will appear.
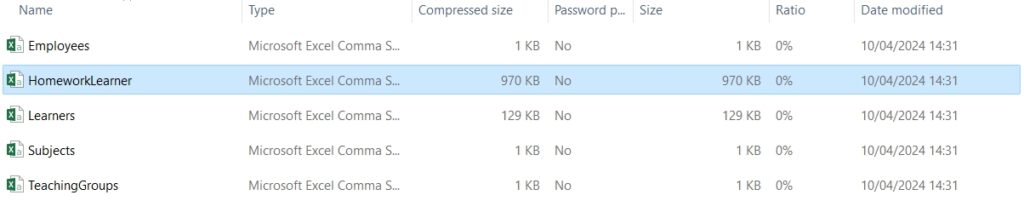
You can manipulate the data within the folder to create an analysis or graph.
Document Access Report
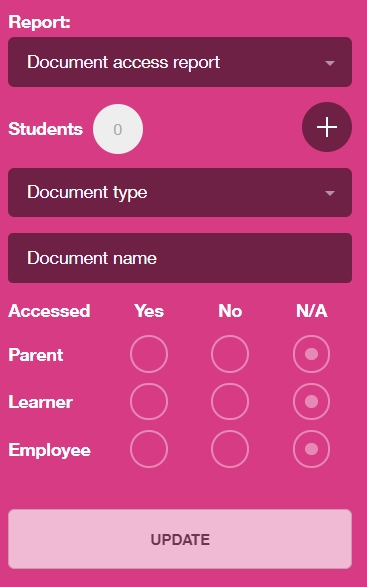
You can view data on document access for learners, parents and employees through Document Access Report.
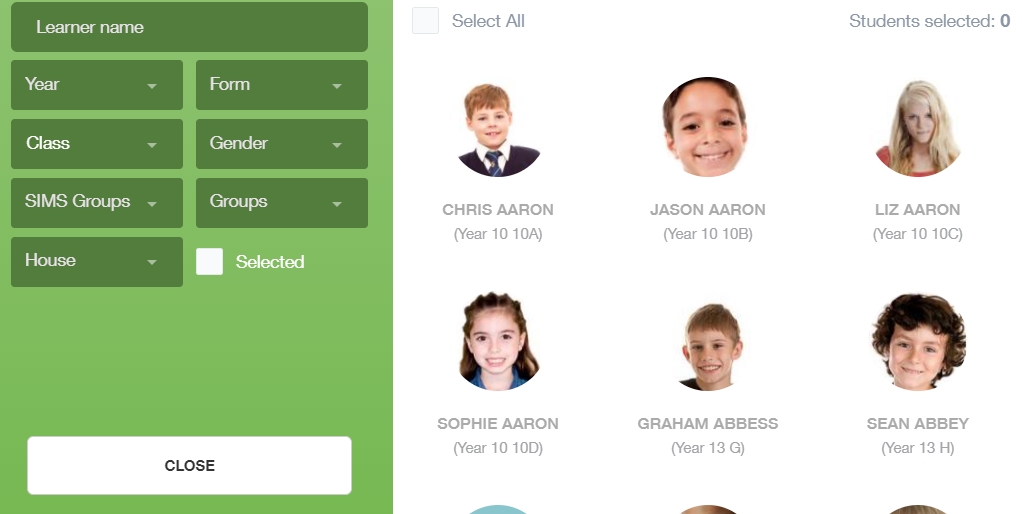
Select students to view on the Document Access Report by clicking the + button.
Select the learner(s) you want to include in the report by clicking on their images. You can filter by Year and tick Select All learners if you want to see document access for each child in a year group. Use the filters to help you narrow down the learners.
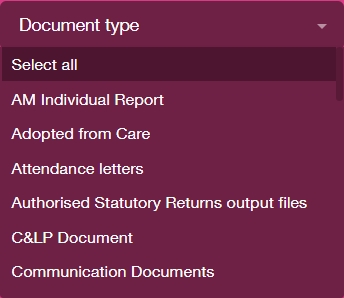
Document Type: Select the document type from the dropdown menu, e.g. General. It is important to realise that the document type must be exact for this to work.
Document Name: Like Document Messaging, Document Access Reports requires a certain amount of precision to access the data you need. You must filter your report further by including the exact document name you are looking for.

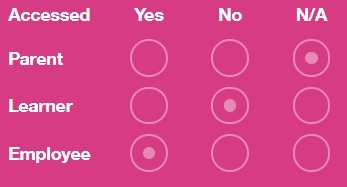
Accessed: Lastly, filter the users you would like to see have accessed the document. For learner documents, this would likely be learners and parents. If an employee must access a learner document, then include them as well. If any group is not required, select N/A.
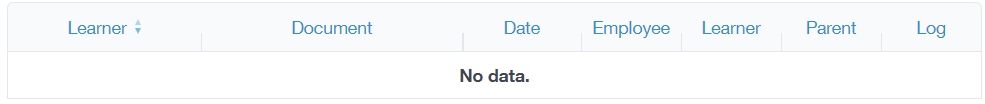
When finished, click the Update button. A table will appear in the window adjacent to the Report filters.

The table will illustrate the figures for document access among specific user groups. The data is for each Learner, Document, and Date then shows the user groups that have accessed the document, Employee, Learner and Parent. Lastly, a log appears if you click on the magnifying glass. The dates and times the user(s) accessed the document will be generated.
Employee Callout Overview
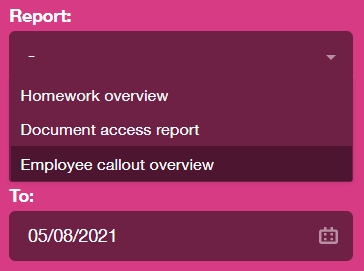
To view employee callout data, use the analytics filter to select the Employee Callout Overview. Then, select the relevant ‘To’ date(s) for your data within the calendar.
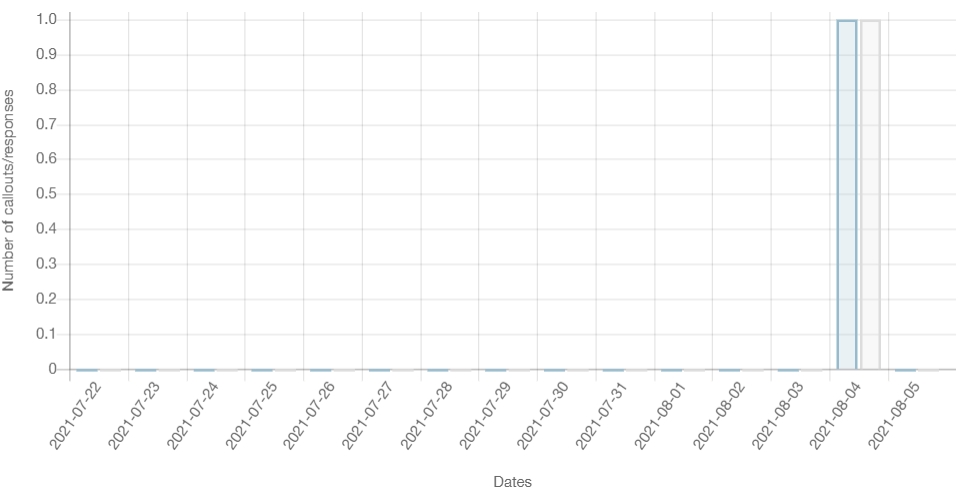
Adjacent to the analytics report type, a graph outlines the statistics for Employee Callouts in the period stated in the calendar. Along the X-axis, dates for callouts are visible, and along the Y-axis the number of callouts/responses are visible. The bar indicates the number of callouts for a particular date.
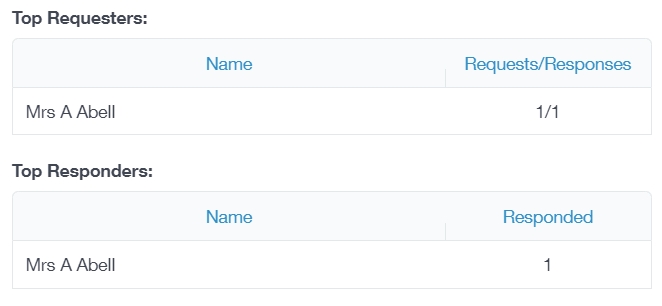
Underneath the graph, is an overview of the Top Requesters of callouts (employees that request callouts often) and the Top Responders to callouts (employees that respond to callouts and the frequency of their response).
Club Attendance Overview
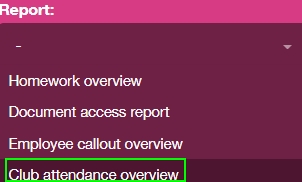
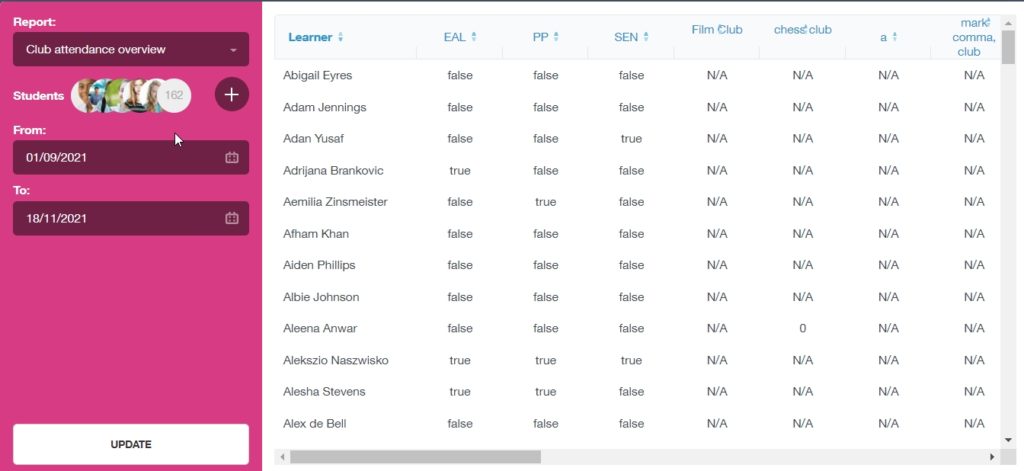
To view and export an overview of all the clubs at your school, select Club Attendance Overview from the Report dropdown menu.
Next, select your students by clicking the + button.

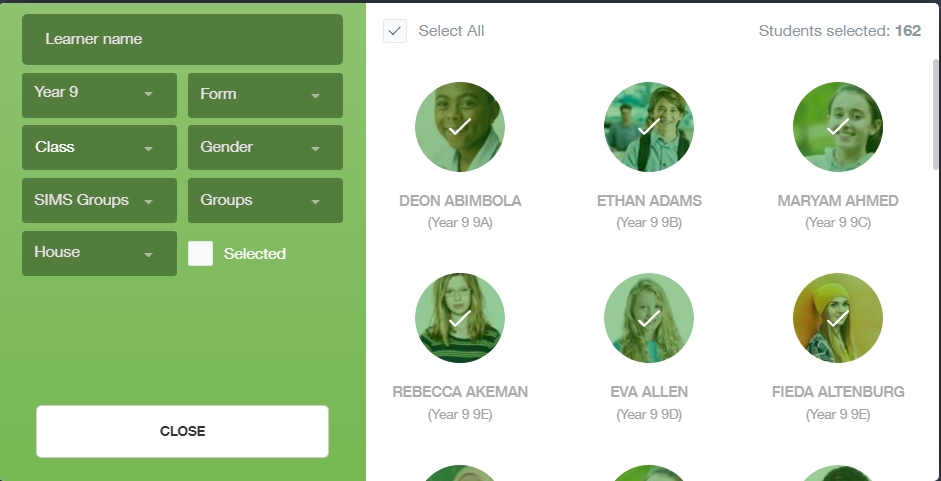
A new window will open where you can select the learners by using the fields to narrow your search. You can select one individual learner by using the search bar, or you can select a group of students.
In the example below, Year 9 has been filtered and selected by ticking the Select All box. If you want to select an individual or smaller group of learners, simply click on their picture and tick the Selected box.
When you have finished, click the Close button.
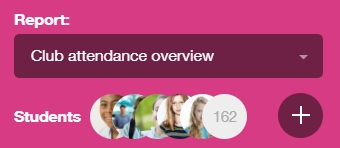
The learners will be updated on the main Analytics page, as below.
Then, select the From and To dates you would like to generate a report for. This will generate a full overview of club attendance from these dates.
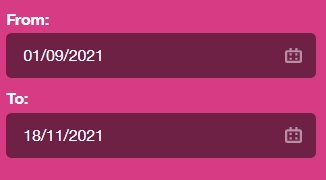
After this step, click the Update button to view the overview.

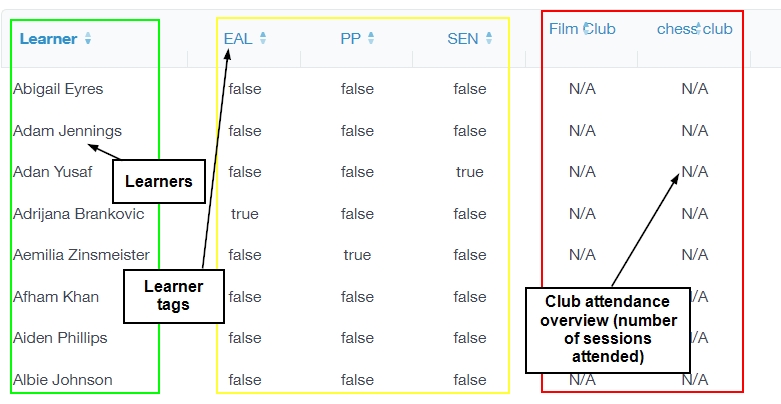
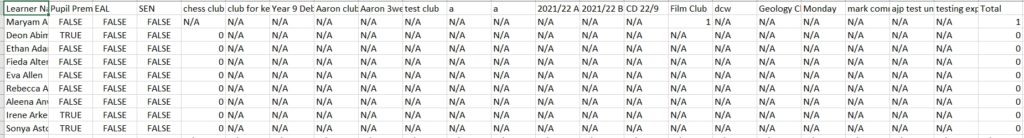
Your screen will update with the information for your club overview. It details the learners and whether or not they are EAL, PP or SEN; you can scroll vertically to see all learners selected. The table also includes a breakdown of the attendance of all clubs and you can scroll horizontally to view them all.
To export your clubs, click on the Export button the top of the Analytics screen.
The file exports and downloads to your computer as a .csv file. Once it has downloaded, click on file to open the document.
Analytics: Part 1 Video
Behaviour Overview, Achievement Overview and Attendance Statutory Overview
To view the analytics report for behaviour overview, achievement overview and attendance statutory overview, please see the following articles for Achievement Overview, Behaviour Overview and Attendance Statutory Overview.
Select the back arrow on the Analytics icon to return to the main homepage.
Click to view the Analytics: Part 2 video.

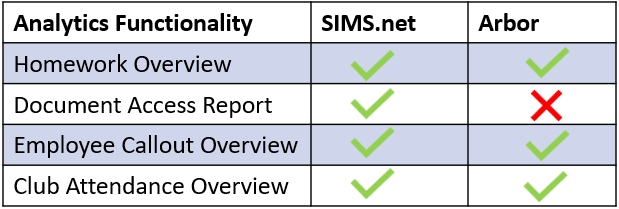
MIS Compatibility